
Why your money plan needs a timeline, not a spreadsheet
A spreadsheet shows one snapshot. A timeline shows every year at once — and that changes the decisions you make. This is the core idea behind excited.live.
Money advice loves snapshots: your balance today, your rate of return, your monthly budget. But a life is not a snapshot — it is a sequence of years, and the interesting questions live in that sequence.
Snapshots hide the shape of your life
Open a typical financial plan and you get a table: income here, expenses there, a balance at the bottom. It answers “where am I” but says nothing about “what happens next”. Real plans have a shape — the tight years while the kids are small, the cushion years when income peaks, the fragile stretch right after retirement when sequence risk is at its worst.
Two plans with identical ending balances can have completely different shapes, and the shape is where the risk lives. A spreadsheet averages that story away.
The question is always “when”, not “how much”
Every real money question is temporal in disguise:
- Can I stop full-time work at 50? — a when question.
- How long can I sustain this spending? — a when question.
- What happens to all of this if my income dips for two years? — a when question.
“How much” questions fit spreadsheets because a cell holds a number. “When” questions don’t fit, because the answer depends on every year before it and every year after it.
Simulation beats prediction
You cannot predict your future returns, your future health costs, or the next market crash. What you can do is simulate: lay out your years as a timeline, apply your events in order, and watch how one change cascades.
The math underneath is simple compounding. Each year:
where Bₜ is your balance, Sₜ what you save that year, and r the return you assume. The power is not in the formula — it is in watching every year of the curve respond when you change one input.
What this looks like in excited.live
You describe your life as events on a timeline — income, expenses, one-off shocks — and the simulator draws every year at once.
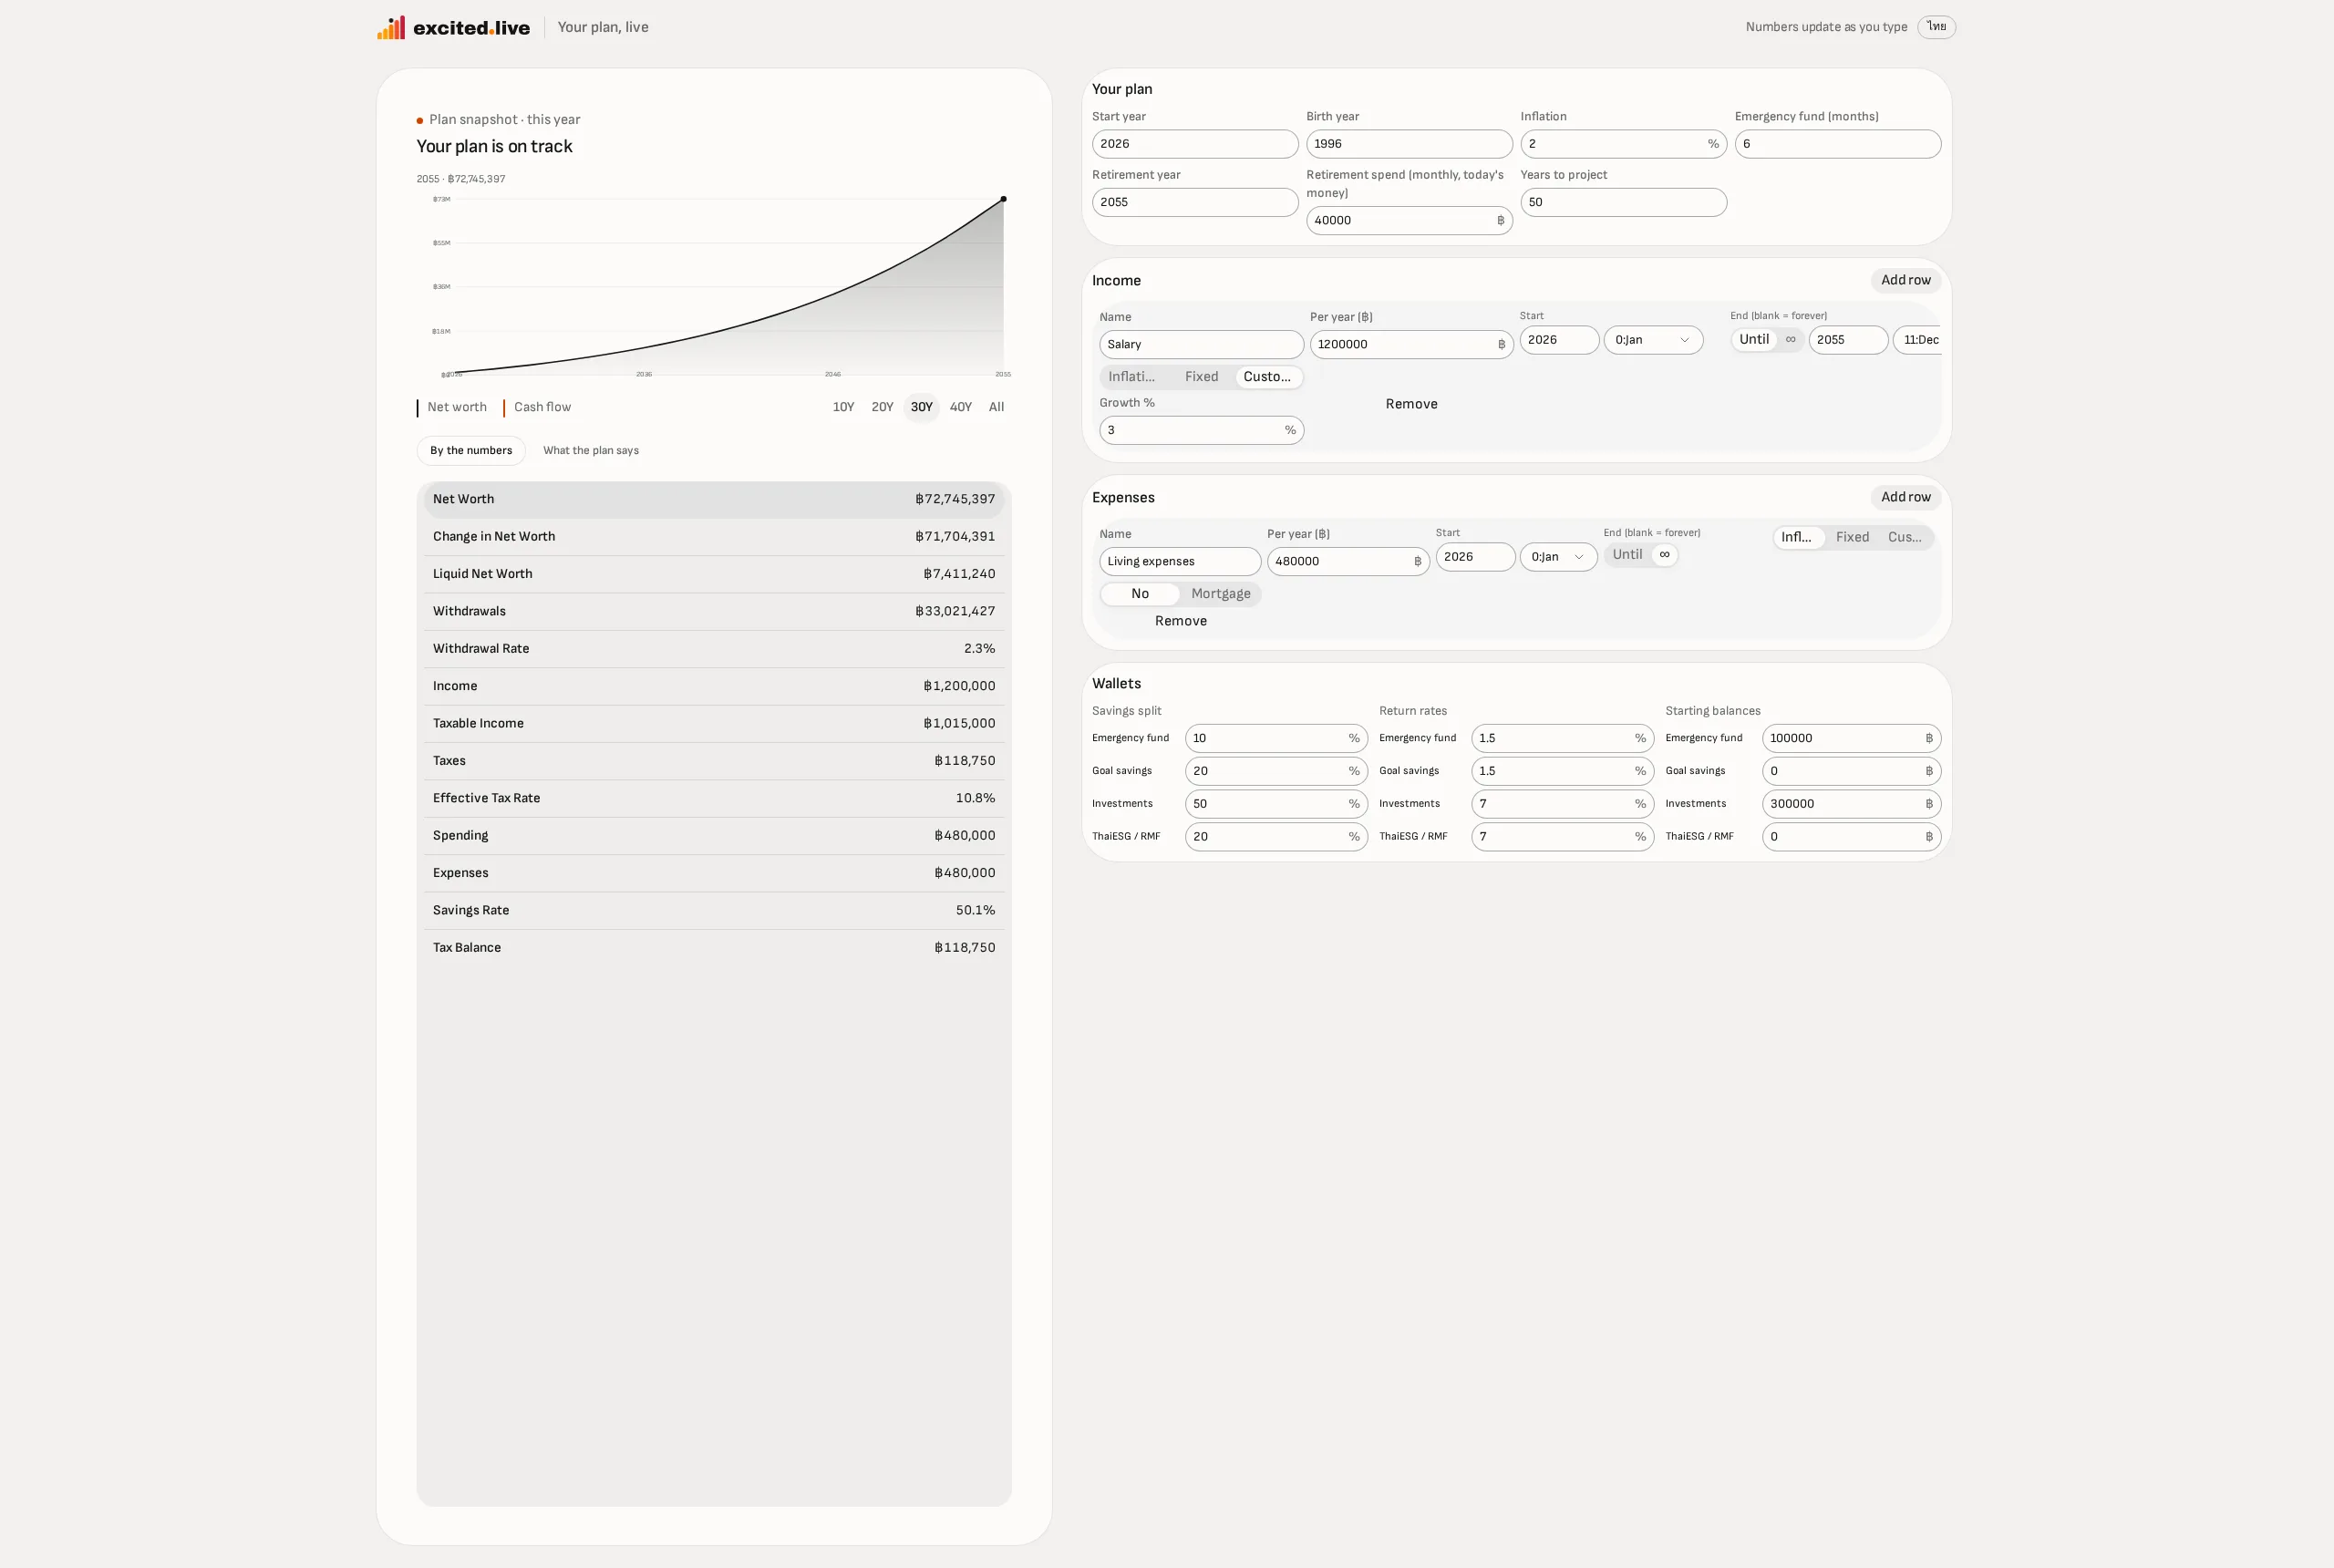
Change an assumption and the whole curve re-draws instantly, so you can feel the trade-off instead of imagining it. That is the idea this whole product is built on. The rest is interface.